PREFIRE
Polar Radiant Energy in the Far InfraRed Experiment
Revealing new aspects of the Arctic climate by measuring the full spectrum of polar radiant energy.
Overview
PREFIRE makes the first full spectral measurements of Far InfraRed (FIR) radiation, revealing the full spectrum of Arctic radiant energy. It fills a major gap in our knowledge of the Arctic energy budget and the role of FIR radiation in Arctic land, ice, and ocean changes.
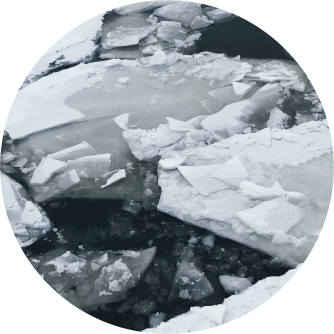
The Arctic is Earth’s thermostat. The tropics receive more energy from the sun than the polar regions, atmospheric motions transport that extra amount poleward, and excess energy is vented into space by the polar regions.
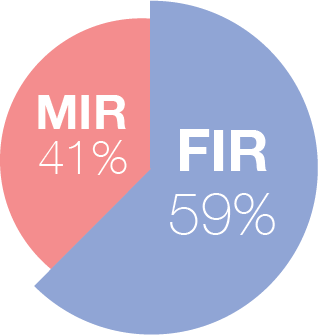
Nearly 60% of Arctic emission occurs at wavelengths longer than 15 μm (FIR) that have never been systematically measured.
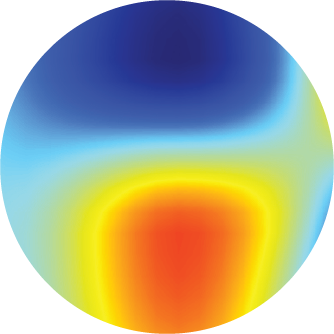
PREFIRE quantifies spatial and temporal variability in spectral FIR emission and the residual energy from atmospheric radiative transfer.
Mission
How are we measuring and what will we do with the data?
PREFIRE measures variations in FIR emissivity and residual energy from atmospheric radiative transfer via thermal radiometric sampling at the top of the polar atmosphere. These measurements are integrated with models to understand the role of FIR radiation in Arctic climate.
Baseline Mission
Two 6U CubeSat spacecraft in two different 525 km altitude, near-polar sun-synchronous (97.5° inclination) orbits, each with a heritage miniaturized IR spectrometer, covering the 3-54 μm wavelength region at approximately 0.84 μm spectral sampling, operating for about one seasonal cycle (about a year) with diurnal subsampling.
Threshold Mission
One 6U CubeSat spacecraft (525 km altitude) in near-polar sun-synchronous orbit (97.5° inclination), operating for approximately half a seasonal cycle (about 6 months).
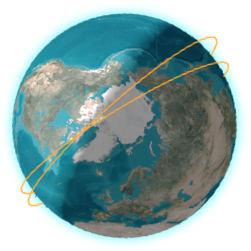
CubeSat Orbit
Two spacecraft in near-polar orbits sample Arctic and Antarctic surfaces and clouds, providing multiple observations of those regions each day.
Instrument
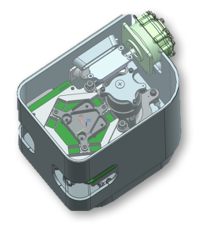
TIRS Opto-mechanical design
Thermal IR Spectrometer (TIRS)
- Flight-proven hardware and design—TIRS uncooled detector and filter block design maturity are from Mars Climate Sounder and Diviner
- Instrument has adequate margins (mass, power, volume, and data rate)
- Orbit and mission design flexibility for accommodating different launch opportunities
Technical Specifications
Science Team
-
University of Wisconsin, Department of Atmospheric and Oceanic Sciences, and Space Science and Engineering Center
- Tristan L’Ecuyer, Principal Investigator
- Erin Hokanson Wagner, Data Systems Manager
- Tim Michaels
- Kyle Mattingly
- Nate Miller
- Denis Botambekov
- Cam Bertossa
- Natasha Vos
- Hamish Prince
- Carolyn Bean
- Rena Sletten
- Erin Duke
- Brian Lin
- Natalie Utomo
- Greta Schultz
- Kevin Hrpcek (pre-launch, and until November 2024)
- Finn Swanson (summer 2024)
- Meredith Grames (pre-launch and summer 2024)
- James Anheuser (pre-launch)
- Cassidy Johnson (pre-launch)
- Ethan Nelson (pre-launch)
-
NASA Jet Propulsion Laboratory (JPL)
- Brian Drouin, Deputy Principal Investigator
- Brian Kahn, Co-Investigator
- William Mathews
- Baijun Tian
-
University of Michigan, Department of Climate and Space Sciences and Engineering
- Xianglei Huang, Co-Investigator
- Aronne Merrelli, Co-Investigator
- Xiuhong Chen
- Zhenning Yang
- Colten Peterson (pre-launch)
- Yan Xie (pre-launch)
-
Geophysical Fluid Dynamics Laboratory (GFDL), Ocean and Cryosphere Division
- Nicole Schlegel, Co-Investigator
-
University of Colorado Boulder, Department of Atmospheric and Oceanic Sciences
- Jennifer Kay, Co-Investigator
- Jonah Shaw
- Leah Bertrand
- Ethan Durham
- Ash Gilbert
For more information, contact Erin Hokanson Wagner
Latest News
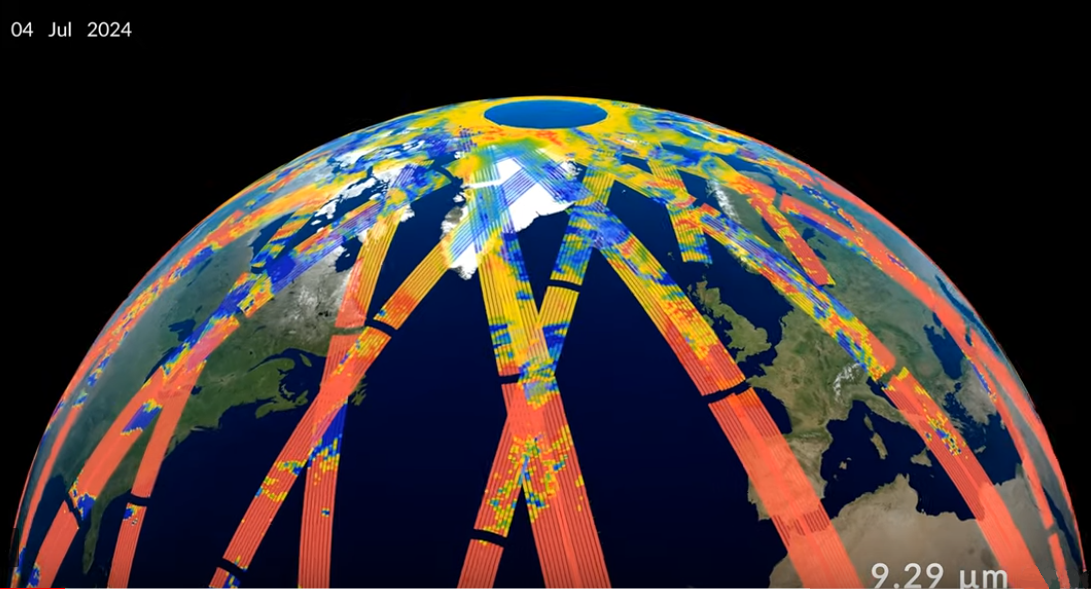
PREFIRE First Light Announcement!
September 3, 2024NASA has publicly released the first look at PREFIRE mission data, also known as the first light announcement! The PREFIRE science team worked with NASA’s Scientific Visualization Studio to create a first light video. It showcases some of the fascinating infrared details of the Arctic surface and atmosphere that PREFIRE-SAT2 captured in July 2024. The PREFIRE science team is hard at work analyzing the countless measurements that the twin CubeSats are radioing to the ground every day.
Read more
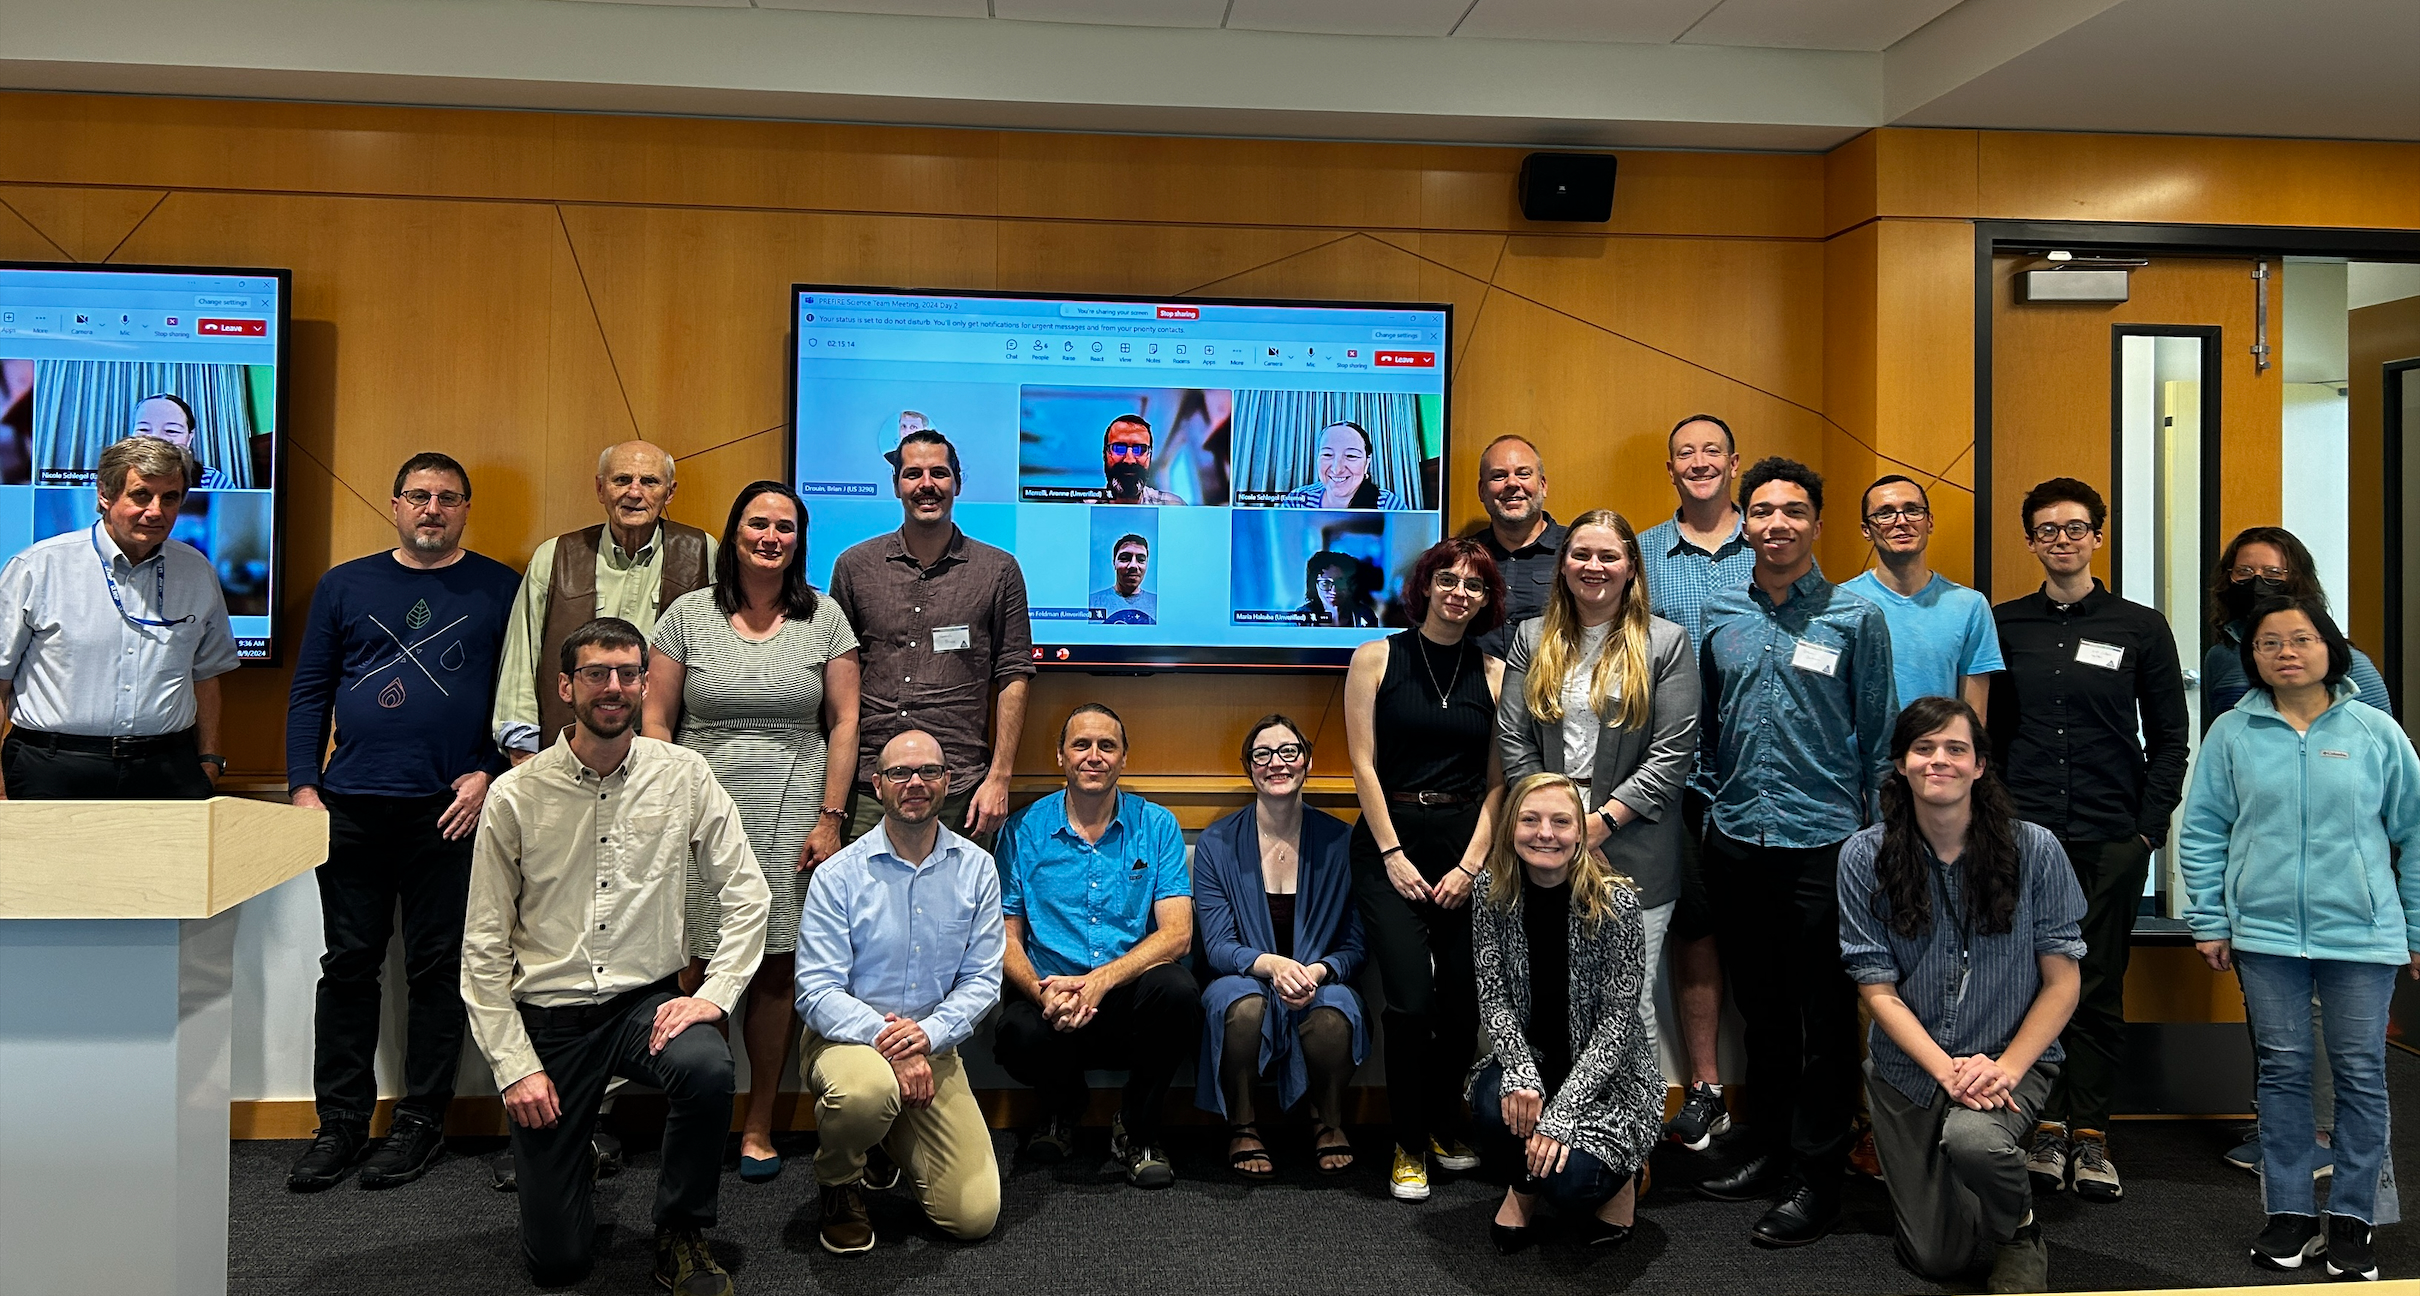
2024 PREFIRE Science Team Meeting
August 15, 2024The 2024 PREFIRE Science Team Meeting was held at the University of Colorado on August 8th and 9th. The PREFIRE team, led by Tristan L'Ecuyer (PI) discussed the status of the PREFIRE CubeSats and instruments, the Science Data Processing System (SDPS), and preliminary data output, as well as the nuances and considerations of this unique dataset. The team also discussed potential validation activities and heard from several external scientists about related projects with the potential for both collaboration and validation.
Read more
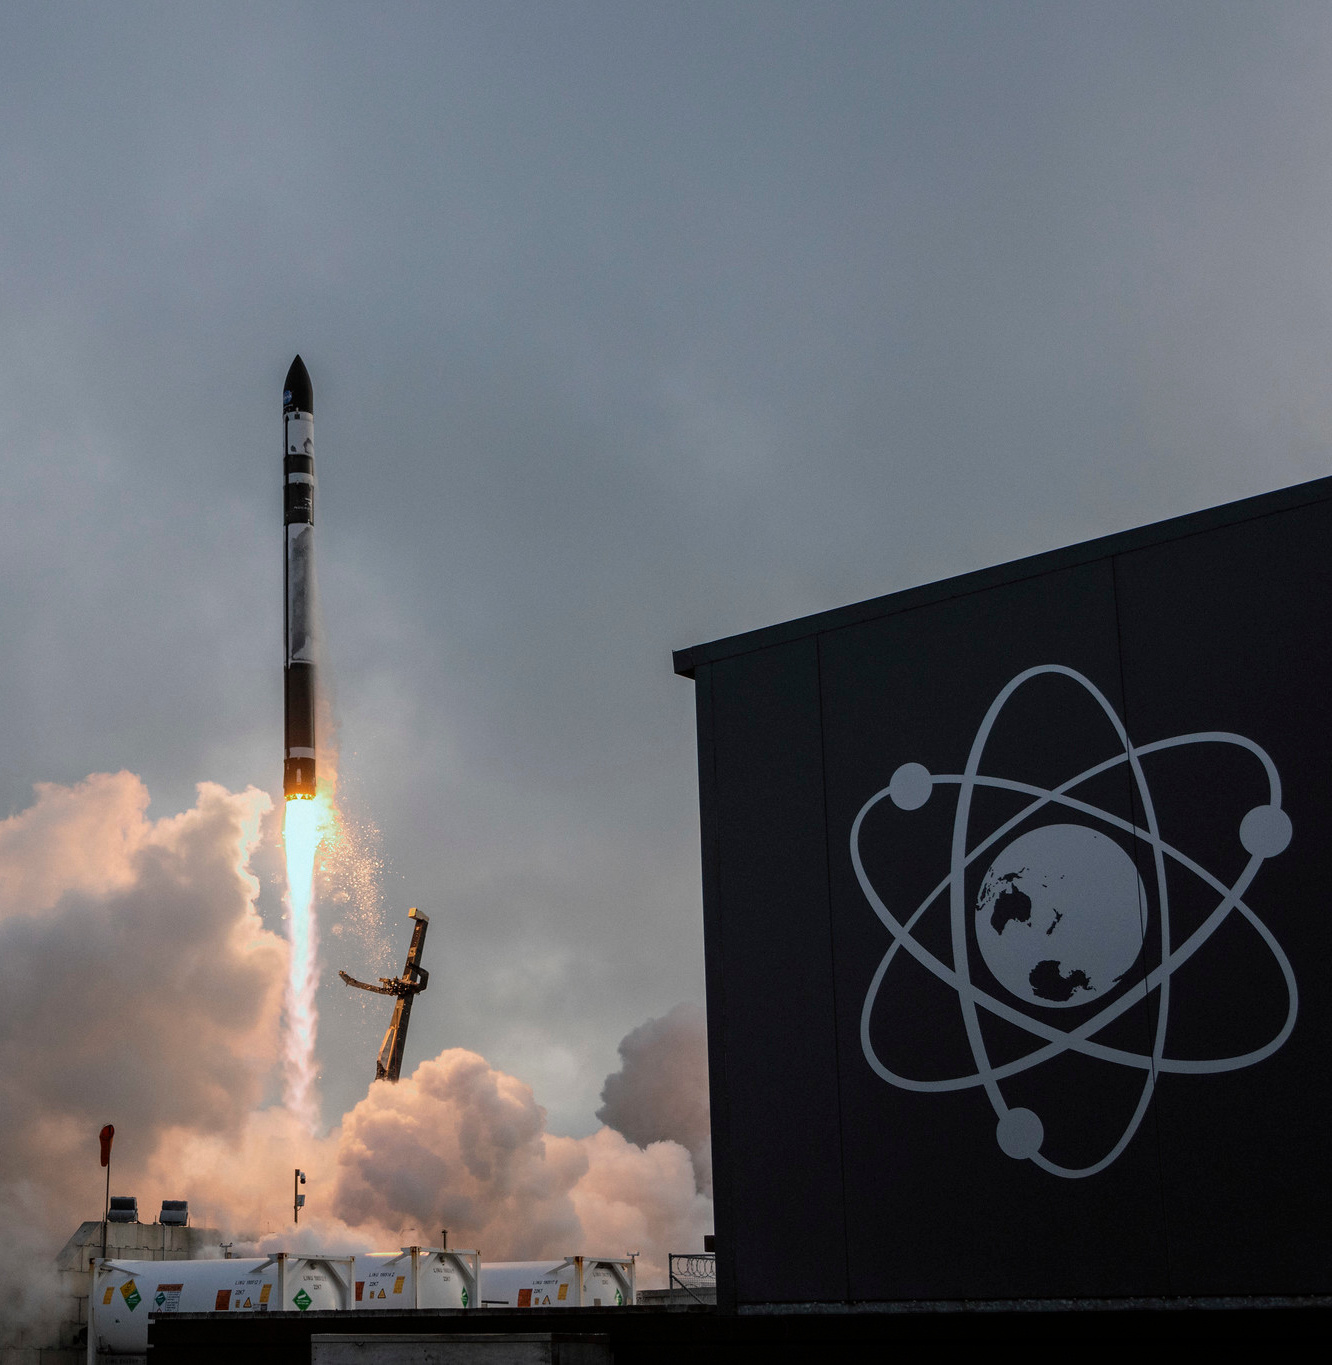
Second PREFIRE Satellite Launched!
June 5, 2024Rocket Lab successfully launched the second of two PREFIRE satellites from Mahia, New Zealand at 3:15 pm NZST (3:15 am UTC).
Read more
Publications
Publications
- Peterson, C., X. Chen, Q. Yue, and X. Huang, The spectral dimension of Arctic outgoing longwave radiation and greenhouse efficiency trends from 2003 to 2016, Journal of Geophysical Research: Atmospheres, 124, 8467–8480, 2019, https://doi.org/10.1029/2019JD030428
- Kahn, B.H., B.J. Drouin, and T.S. L’Ecuyer, Assessment of sampling sufficiency for low-cost satellite missions: Application to PREFIRE, Journal of Atmospheric and Oceanic Technology, 37, 2283–2298, 2020, https://doi.org/10.1175/JTECH-D-20-0023.1
- L'Ecuyer, T.S, B.J. Drouin, J. Anheuser, M. Grames, D. Henderson, X. Huang, B.H. Kahn, J.E. Kay, B.H. Lim, M. Mateling, A. Merelli, N.B. Miller, S. Padmanabhan, C. Peterson, N. Schlegel, M.L. White, and Y. Xie, The Polar Radiant Energy in the Far InfraRed Experiment: A new perspective on polar longwave energy exchanges, Bulletin of the American Meterorological Society, 102, E1431–E1449, 2021, https://doi.org/10.1175/BAMS-D-20-0155.1
- Xie, Y., X. Huang, X. Chen, T.S. L’Ecuyer, B.J. Drouin, and J. Wang, Retrieval of surface spectral emissivity in polar regions based on the optimal estimation method. Journal of Geophysical Research: Atmospheres, 127, e2021JD035677, 2022, https://doi.org/10.1029/2021JD035677
- Bertossa, C., T.S. L'Ecuyer, A. Merrelli, X. Huang, and X. Chen, A neural network-based cloud mask for PREFIRE and evaluation with simulated observations. Journal of Atmospheric and Oceanic Technology, 40, 377–396, 2023, https://doi.org/10.1175/JTECH-D-22-0023.1
- Mattingly, K.S., J.V. Turton, J.D. Wille, B. Noel, X. Fettweis, A.K. Rennermalm, and T.L. Mote, Increasing extreme melt in northeast Greenland linked to foehn winds and atmospheric rivers. Nature Communications, 14, 1743, 2023, https://doi.org/10.1038/s41467-023-37434-8
- Miller, N.B., A. Merrelli, T.S. L’Ecuyer, and B.J. Drouin, Simulated clear-sky water vapor and temperature retrievals from PREFIRE measurements. Journal of Atmospheric and Oceanic Technology, 40, 645–659, 2023, https://doi.org/10.1175/JTECH-D-22-0128.1
- Shaw, J.K., and J.E. Kay, Processes controlling the seasonally varying emergence of forced Arctic longwave radiation changes, Journal of Climate, 36, 7337–7354, 2023, https://doi.org/10.1175/JCLI-D-23-0020.1
- Prince, H.D., and T.S. L'Ecuyer, Observed Energetic Adjustment of the Arctic and Antarctic in a Warming World, Journal of Climate, 37, 2611–2627, 2024, https://doi.org/10.1175/JCLI-D-23-0294.1
Dataset
Dataset
The PREFIRE project started science operations (after in-orbit checkout) in early summer 2024, with standard science data acquired- for PREFIRE-SAT1 on and after 2024-07-24 @ 20:45:50 UTC
- for PREFIRE-SAT2 on and after 2024-06-29 @ 21:18:39 UTC
PREFIRE mission and science data products are hosted by the NASA Atmospheric Science Data Center. They can be accessed via NASA Earthdata Search.
Resources